
Missed Nvidia’s Run? Alibaba’s AI Rocket Could Soar to $200-300 in 2025—Act Fast (smartly)
Discover How Alibaba’s AI Boom Could Hit $200 by 2025—Plus Key Chart Levels and Winning Trade Plans!"


Imagine kicking yourself for missing Nvidia’s meteoric rise—only to discover Alibaba ($BABA) might be the sleeper AI play of 2025, ready to skyrocket past $200 by year-end. If you’re staring at an overbought U.S. market, wondering where the next big opportunity lies, China’s tech giant is breaking out of a multiyear slumber, and the chart is screaming opportunity. Stick with me, and I’ll walk you through why BABA isn’t just a value buy—it’s your chance to ride the next AI wave before the crowd catches on.
I’ll cover the thesis and key levels and possible entry points. In less than 4 weeks, the leaps I alerted reached over 200% profit… I’ll talk about my process for taking profits and adding to position.
Why Alibaba Is the AI Dark Horse You Can’t Ignore
Alibaba Group Holding Limited ($BABA) isn’t just another Chinese stock—it’s a powerhouse pivoting hard into artificial intelligence, positioning itself as a potential game-changer in the global tech landscape. While U.S. markets feel frothy and overbought as of February 2025, Chinese names like BABA appear to be emerging from a multiyear consolidation, offering both value and explosive growth potential. Let’s dive into the history, the chart, and why this could be your ticket to massive returns.
Last year, I started pounding the table on BABA around $80, calling it a long-term hold with massive upside. Fast forward to early February 2025—after Alibaba’s bold moves into the AI world, I alerted followers I love the $130 calls for January 2026. At the time, those calls were just $10; Last week, they surged to $32 after their e/r report, delivering a jaw-dropping 200% return in under a month. Monday, I alerted tht pro members that I liked adding to the position on the pullback to $22-24 range.
My overall price target for BABA? $200+ by the end of 2025. Now, let’s break down the weekly chart and uncover the key levels and trade plan that could make you a believer. If I take a long term positional trade, my intention is for a 1000%+ win while protecting capital. More on process later.
Analyzing the $BABA Weekly Chart: Key Levels and Trade Plan
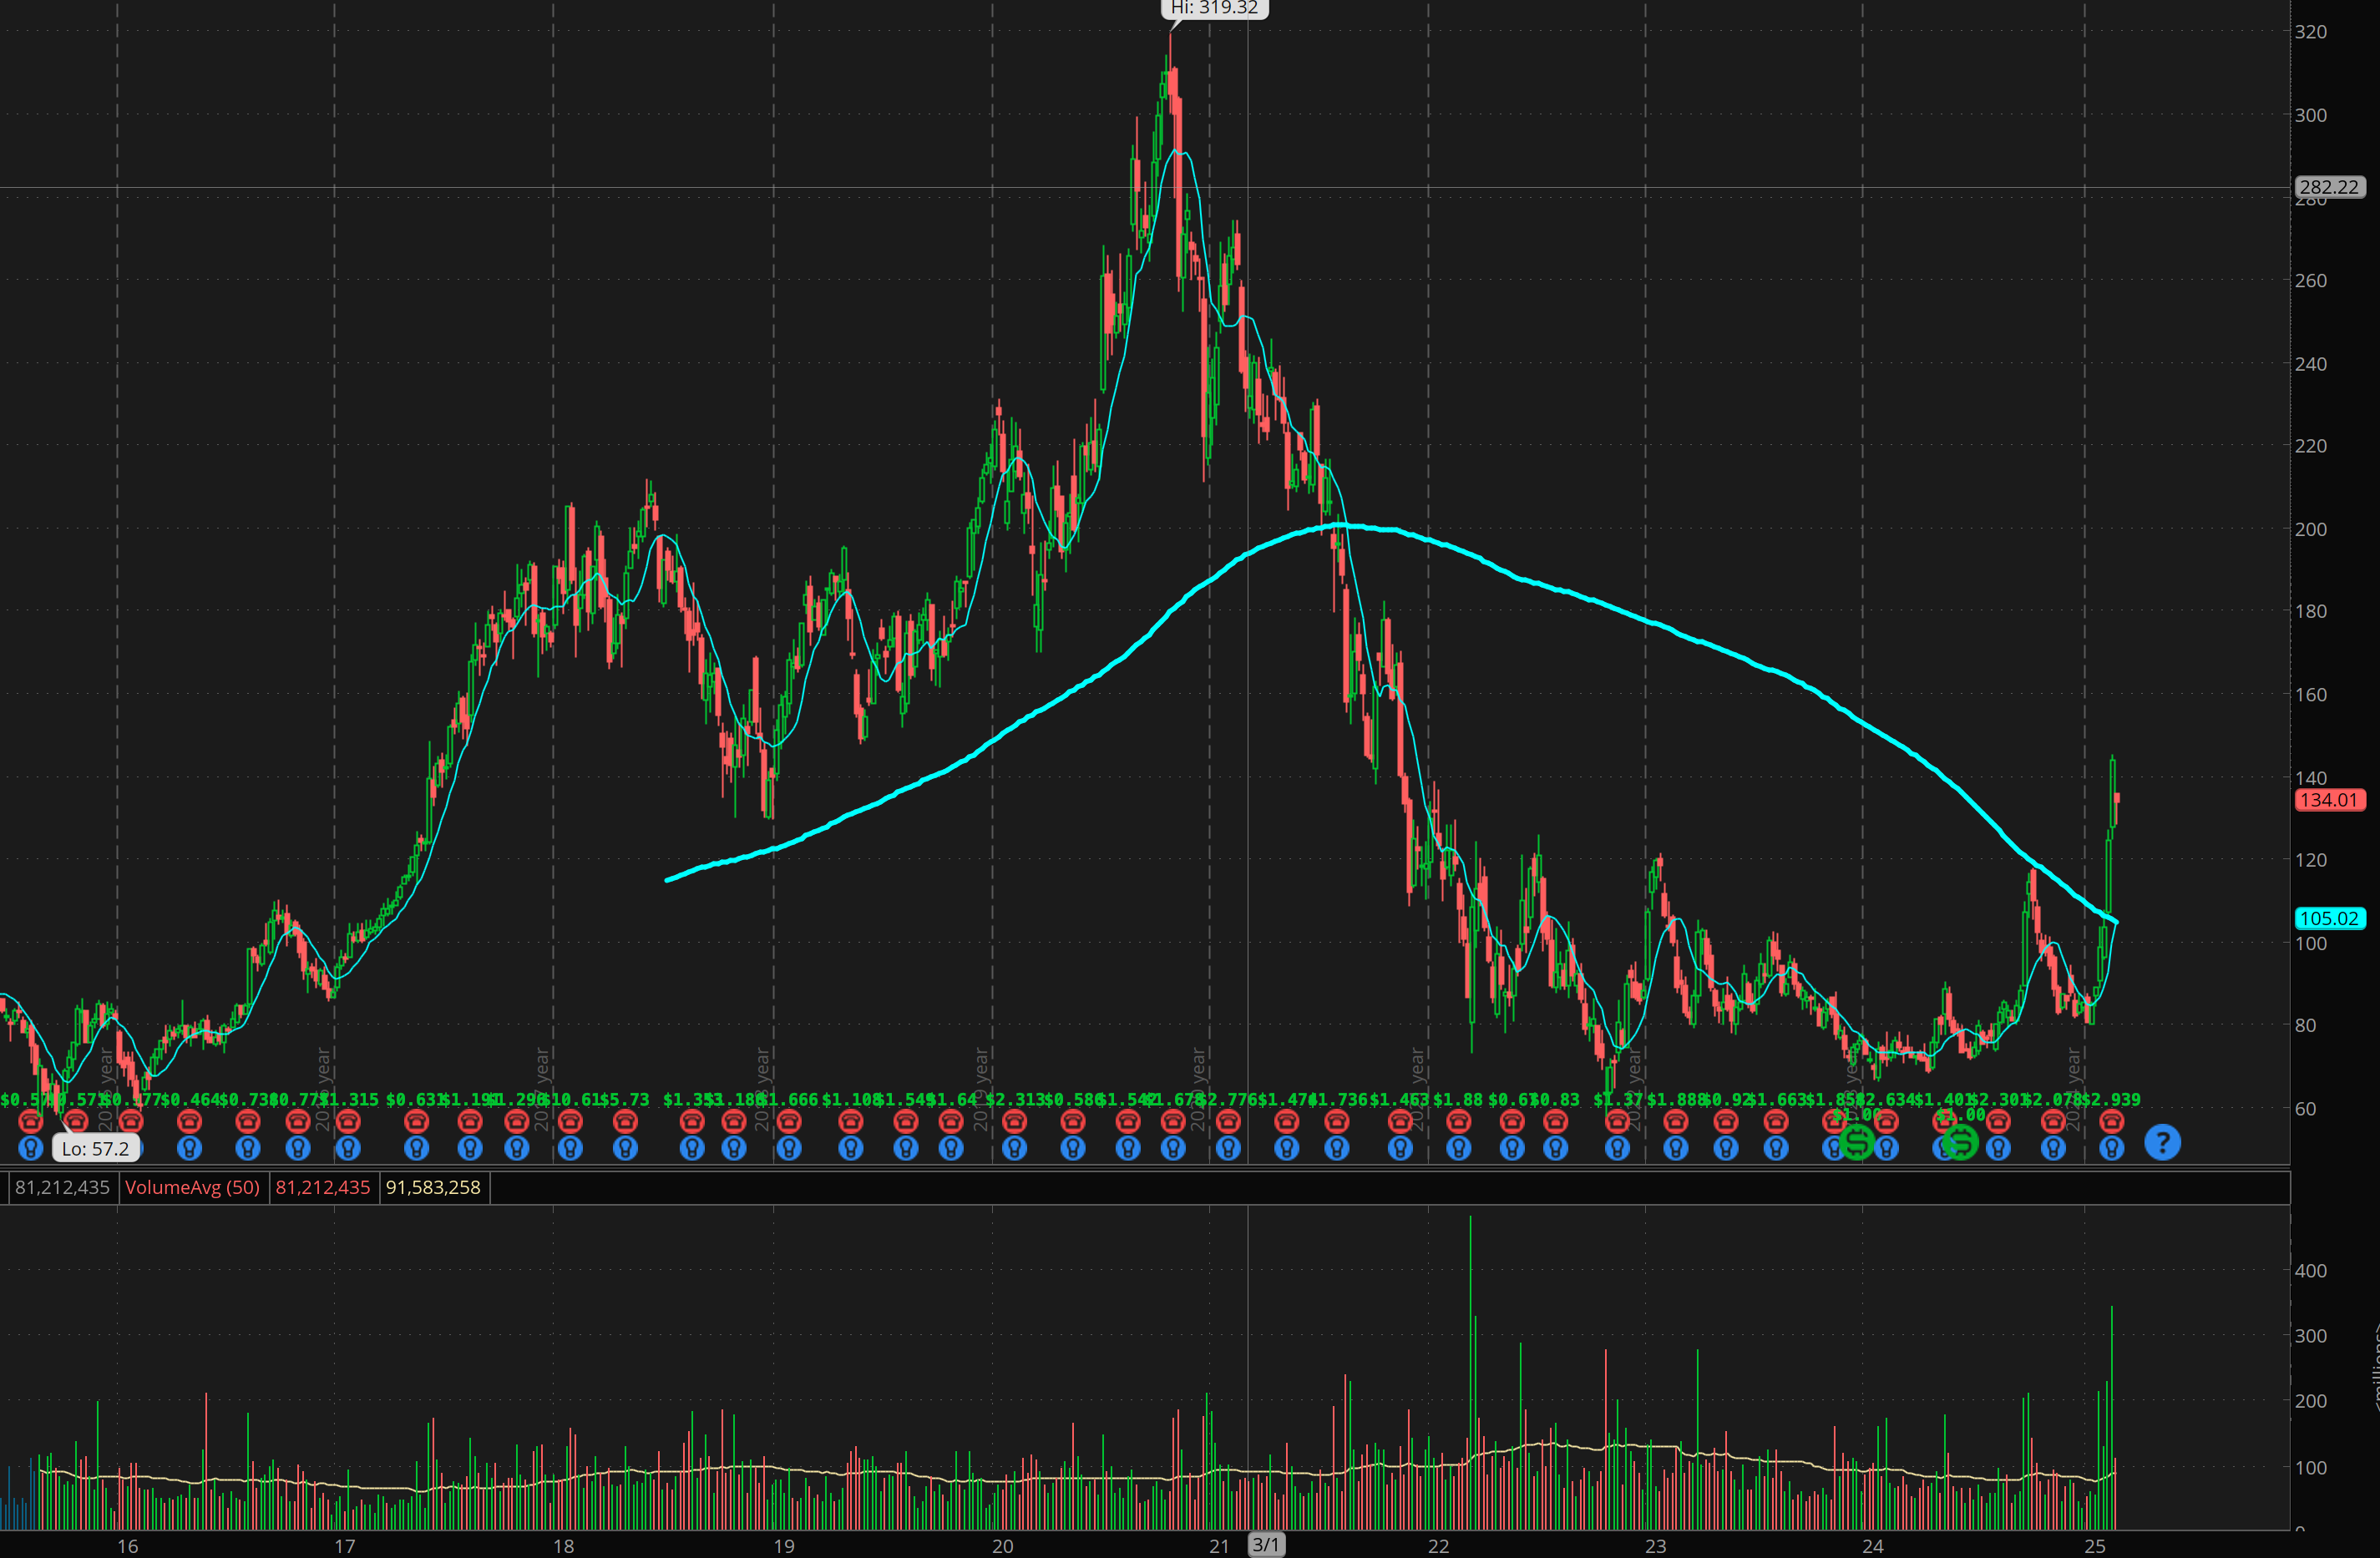
Take a look at this weekly chart of Alibaba ($BABA) as of February 26, 2025. It’s a roadmap to riches—if you know where to jump in and cash out. Here’s what stands out:
Key Levels of Interest
Buyback Zone: $75-$85
Alibaba announced they had done aggressive buybacks due to the stock being severely undervalued. Notice the significant and highest volume bar on the first dip to $80. For reversals, you want to see that level reclaimed.
Support Zone: $100–$110
The chart shows a solid base forming around $100–$110 (previous resistance), where the price has repeatedly found sellers after dipping in late 2024. This zone aligns with the 200-week moving average (the blue line), this is your sweet spot—low risk, high reward to buy in coming months if there is a dramatic dip.Resistance Breakout: $120
BABA recently smashed through the $120 resistance zone, a psychological and technical barrier that had capped gains for months. The sharp green candles and increasing volume signal strong bullish momentum. This breakout is a golden signal that the stock is ready to run.Resistance Zone: $140-$150
BABA had multiyear support around 140-150 Pre-pandemic. Once it clears 150, imho it should be off to the races ad accelerate upwardsTarget Zone: $180–$200+
Based on the chart’s trajectory and Alibaba’s AI-driven growth potential, $180–$200 is the next major target. The stock’s parabolic move in early 2025 (see the sharp upward spike) suggests it could easily test these levels by year-end, especially if AI adoption accelerates. I often underestimate FOMO. I wouldn’t be surprised if we see 220-240. This will give me the 10x I want on our $130 call leaps.Potential Pullback Zone: $120–$125
If volatility hits, watch for a pullback to $120–$125. This level sits just above the recent breakout and could offer a secondary entry point for aggressive traders. The volume profile (those green bars at the bottom) shows solid support here, reducing downside risk.
Trade Plan: Buy, Hold, and Sell
Buy: Enter long positions near $100–$110 on any dips(already positioned), add to positions if the stock pulls back to $120–$125. These levels offer a high probability of success, backed by technical support and bullish fundamentals (AI growth, undervalued multiples compared to U.S. peers).
Hold: Stay patient through normal volatility. Alibaba’s AI initiatives—think cloud computing, e-commerce optimization, and autonomous logistics—are still in their infancy, driving long-term upside. My $200+ target by December 2025 isn’t just wishful thinking; it’s based on the stock’s momentum and China’s tech recovery.
Sell/Partial Profits: Take partial profits on 130c $30-50 if you’re conservative, and for commons lock partial in around $180 but hold core positions for $200+ unless the chart shows a clear reversal (e.g., a breakdown below $110 with heavy selling volume). For options traders, rolling those $130 calls into higher strikes (like $200) could lock in gains while keeping upside potential.
My trading philosophy. Protect original capital.
When I have 200-500% fast gains I like to sell enough to cover my original investment and then set orders to reload on dips.
A new strategy on high conviction trades I’ve started is to sell 20% at 500% gains. This leaves me 80% participation for main targets. I found that on high conviction trades I’m often right, and significantly under perform when I sell 50% at 100-200% gains.
For less conviction trades I will sell 50% at 100-300% profit and exit 80% at 300-500%.
Why BABA Now? The AI Edge and Value Play
Alibaba isn’t just riding China’s recovery—it’s leading it. Its AI investments, from enhancing Taobao’s recommendation algorithms to powering its cloud services, position it as a direct competitor to U.S. tech giants. At current valuations (well below U.S. peers like Amazon or Microsoft), BABA is a screaming value buy with rocket fuel in AI growth. If you missed Nvidia’s run, don’t sleep on this opportunity—BABA could be the next big AI winner, and the chart proves it’s just getting started.
BONUS: Jack Ma is back and that is bring investor confidence. He was MIA for 3 years!
So, are you ready to jump on board before the crowd? The numbers don’t lie, and neither does this chart. Let’s make 2025 our year to shine with Alibaba!
Remember to look for support levels to enter (especially for options) and/or consider dollar cost averaging for long term trades.
Disclaimer: This content is not a solicitation to buy or sell any securities. It represents my personal opinion and analysis based on available data as of February 26, 2025. Investing involves risks, and I am not a financial adviser. Please consult a qualified financial advisor before making any investment decisions.