
Don't miss the next all day grinder in SPY. 4 spot you could have entered on Thu Sep 4
FREE Lesson to learn how to recognize and enter long for all day grinders.
What a day today in SPY. SPY did a 2 level move to the 648 level and gave a bonus squeeze into 649!
Don’t worry about missing the first entry. There were plenty more. I want you to not miss out on these amazing profits! So here is a FREE lesson!
Optimal Entry Points for Going Long
Today’s price action exhibits several layered bullish signals: a gap fill followed by an engulfing reversal candle near the low (~$643.74), a VWAP cross upward with a successful backtest hold, a confirmed failed breakdown reversal, and an ORB60 (60-minute opening range breakout) that backtested and held with a triple bottom formation. These confluences suggest building buyer control after initial weakness, aligning with the broader multi-day recovery context we discussed (post-drop rebound with volume on highs). Volume appears to support the upside moves (e.g., spikes on bounces), and RSI stays in a neutral-to-bullish range (~50-60), avoiding overbought conditions.
Put all these together with my levels and you have a high probability move to 648+.
I told THT PRO members my target on SPX 6480c was 10-20 when it was around $3. They hit $22.
Here are the key points where one could go long, prioritized from earliest (higher risk, potentially better reward) to later (lower risk, confirmed strength). Entries assume a day trading setup with tight risk management (e.g., stops below recent lows or VWAP).
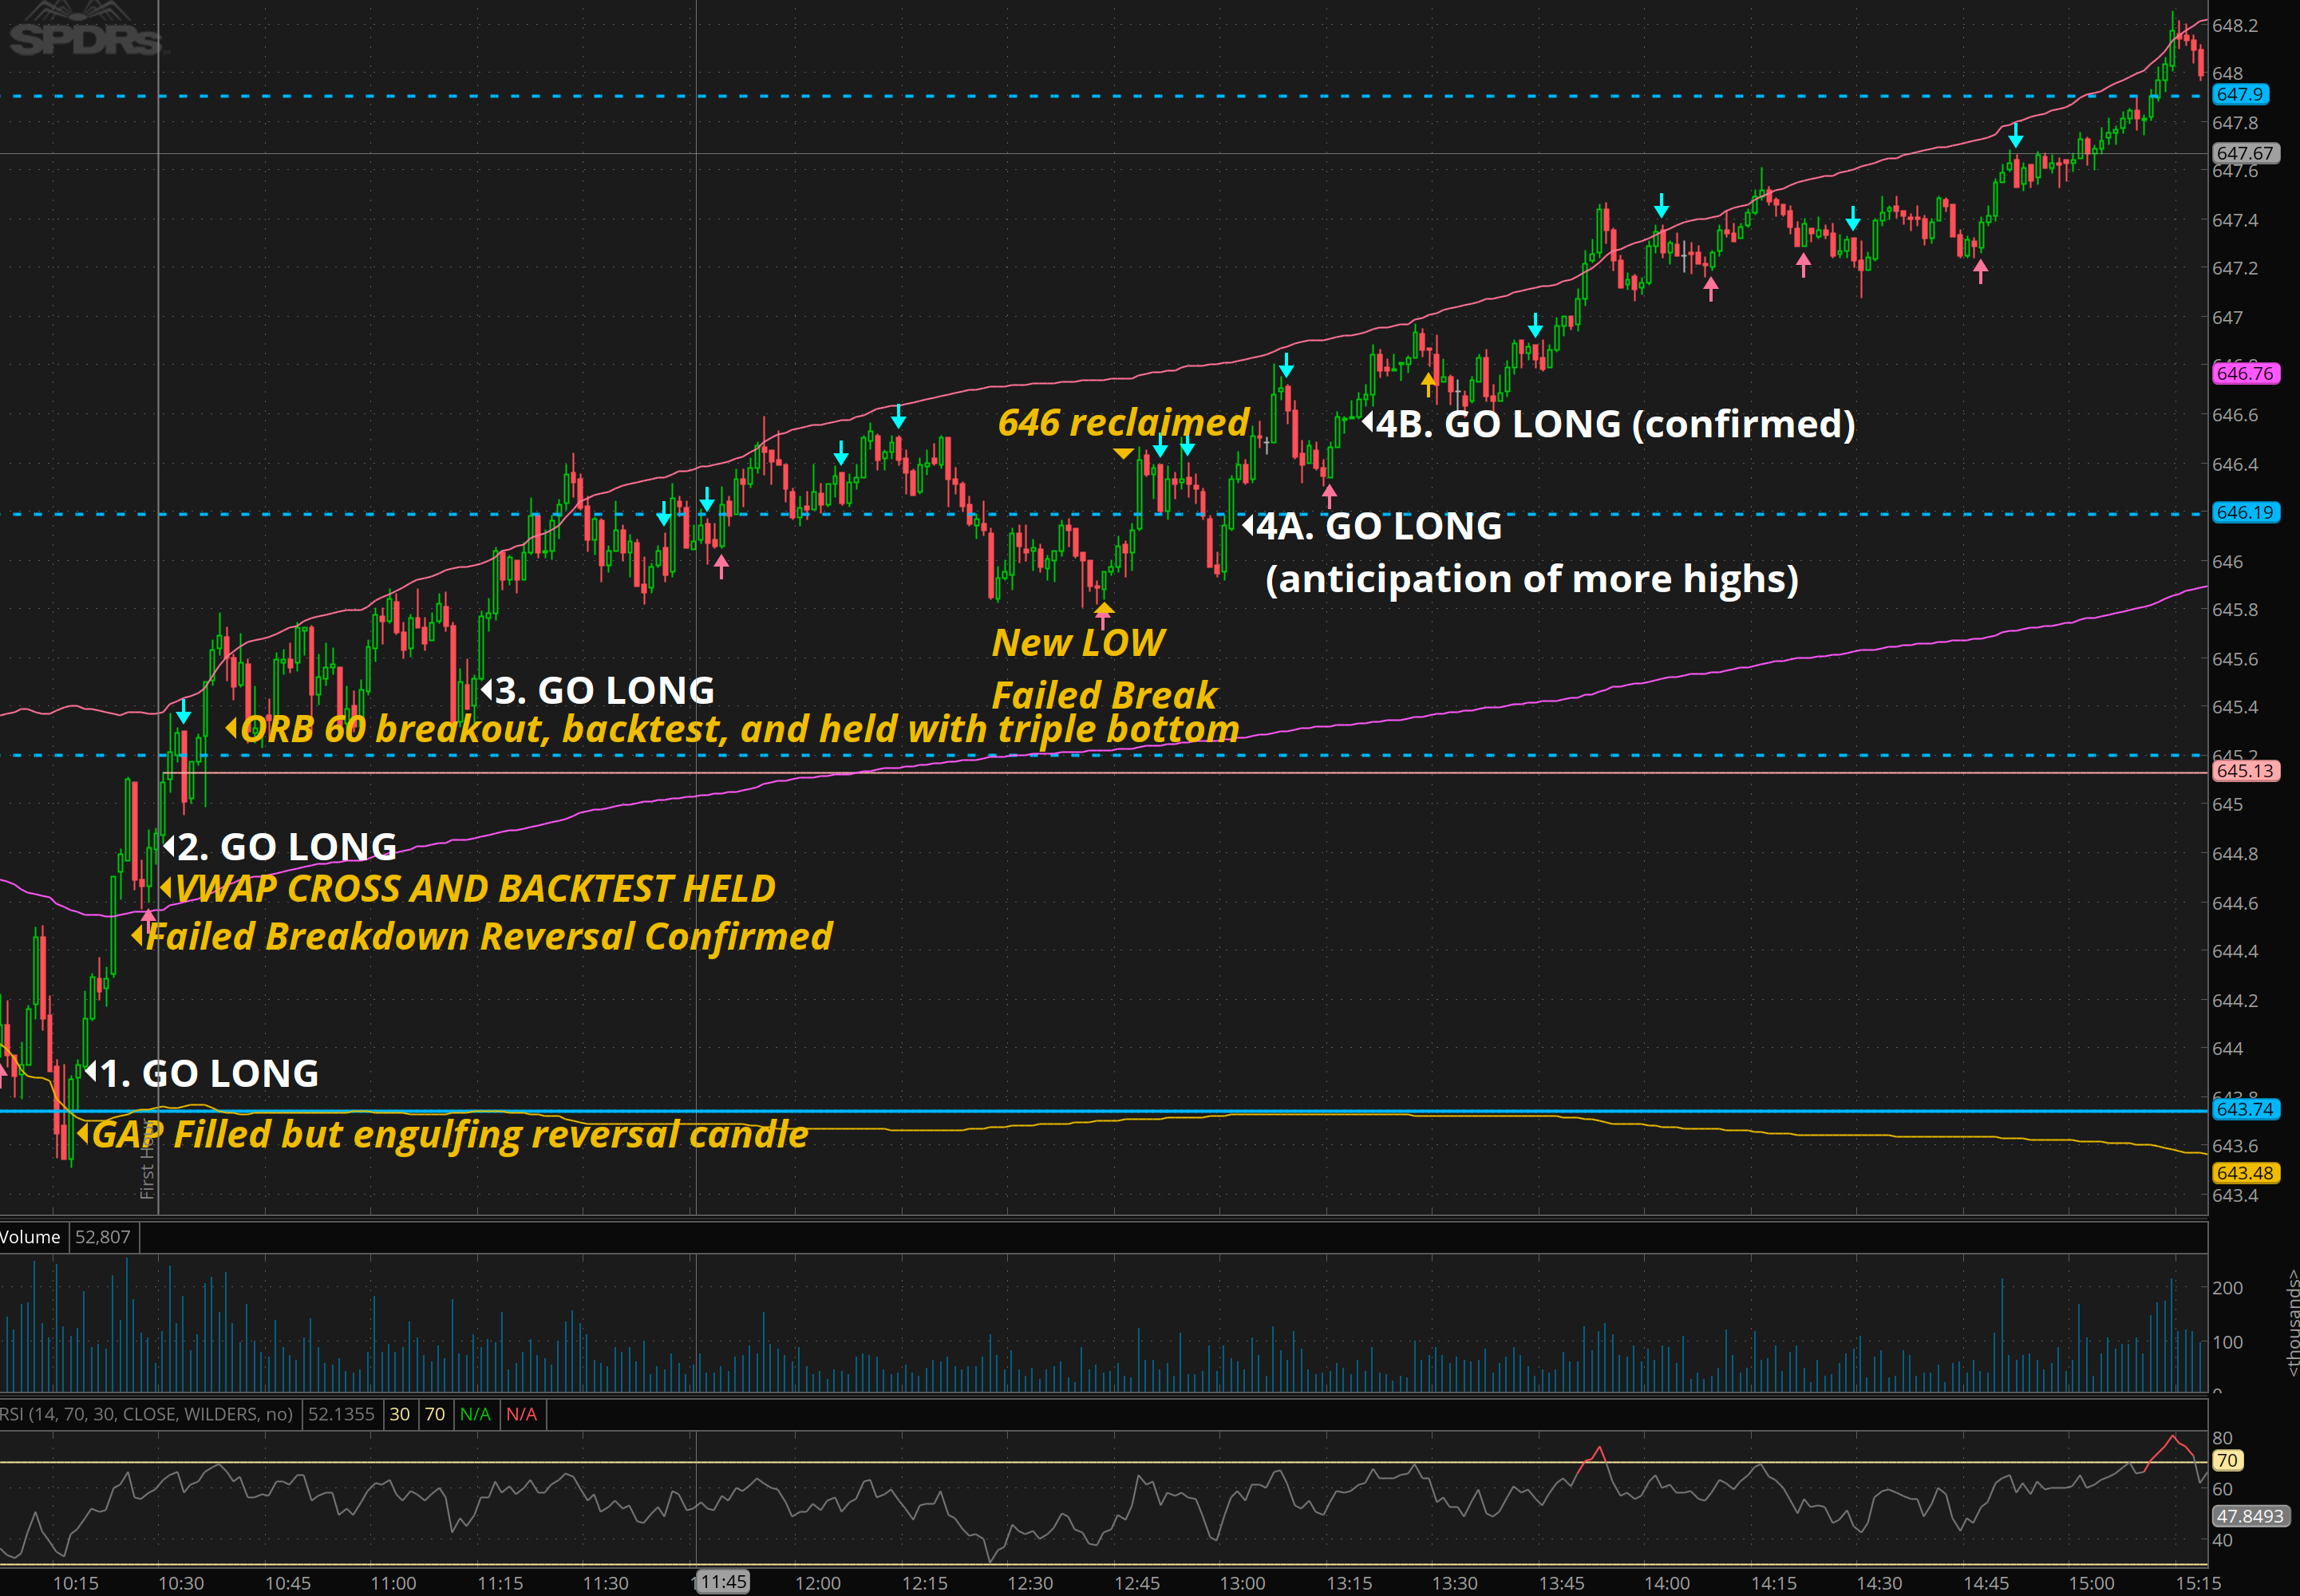
After Gap Fill and Engulfing Reversal Candle (Early Entry, ~$644-645)
Rationale: The gap fill (price dipping to close the overnight gap) often acts as a shakeout, trapping sellers. The engulfing reversal candle (a bullish candle fully encompassing the prior bearish one) signals immediate reversal momentum, as buyers overwhelm sellers at support. This is a classic price action buy signal, especially intraday in SPY, where such patterns after gaps have shown a positive edge in backtests. Historically, bullish engulfing after gap fills in SPY leads to short-term upside in ~55-65% of cases, with average gains of 0.5-1% intraday when volume confirms. In this chart, it coincides with the session low, making it a high-reward spot if support holds. Risk: Place stop below the low (~$643.50) for ~0.50 risk.
On VWAP Cross Upward and Backtest Hold (~$645-646)
Rationale: Crossing above VWAP (volume-weighted average price) indicates buyers are paying "above fair value," showing conviction. The backtest (price dipping back to VWAP without breaking it) confirms it as dynamic support, often leading to accelerated rallies. In SPY intraday backtests, VWAP reclaims after dips have a ~60% win rate for further upside, with stronger performance when volume increases on the cross. Here, it builds on the engulfing reversal, reducing false signal risk. This is a solid momentum entry for scalpers. Risk: Stop below VWAP (~$644.50) for small risk.
On ORB60 Breakout, Backtest, and Triple Bottom Hold (~$645.20)
Rationale: ORB60 (high/low of first 60 minutes) breakout up signals momentum from the open range. The backtest hold with a triple bottom (three tests of support ~$645.30, forming a base) confirms buyer dominance, as sellers exhaust. Triple bottoms in SPY are bullish reversals, succeeding ~74% of the time to hit targets (height of pattern added to breakout). ORB strategies on SPY show ~50-60% win rates intraday, improving with volume and support holds. This is the most conservative entry, as all prior signals align, reducing whipsaw risk. In your chart, this setup targets ~$648+ (pattern height ~$2-3 from low to ORB high). Risk: Stop below level (~$645) or recent backtest (~$645) for 0.5-1% risk.
After Failed Breakdown Reversal Confirmation (~$646)
Rationale: A failed breakdown (attempt to break lower support but reversing instead) traps shorts and fuels squeezes. Confirmation comes via a close above the breakdown attempt level with volume. In SPY, such reversals post-gap fill have led to intraday rallies in ~65% of historical instances, especially in uptrending markets like the current S&P bull. Rhis aligns with the triple bottom emerging, adding confluence. It's a reactive entry for traders waiting for proof of strength. I told THT PRO members that 645.80 break triggers short. It was tested 3 times! indicating strong support
Overall rationale for longs: This setup combines reversal (engulfing, failed breakdown), support (triple bottom), and momentum (VWAP/ORB breakout) in a post-recovery context.
Today’s action didn’t fit my dip-buying with heavy volume pattern, my usual style for entry. Instead it had a different strength confirmation, fitting the squeeze dynamic.
Please telll me about your trading day and share this post if you found it helpful. Leave a comment below!
Good luck today! For live alerts, market commentary, and access to Edge Trade Planner click the button below.
Please like and share this post to spread the knowledge and help your fellow traders!
Disclaimer: All content provided is for educational and entertainment purposes only. It should not be considered financial advise or a recommendation to buy or sell a security. The content is the author’s opinion only and may or may not be accurate. Author may or may not have positions in securities and may or may not open a position in next 48 hours.