
After last week's selling does SPY bounce? -- Trade ideas for Mon Nov 24
Solid ideas by SpectreAI again. It predicted the move from 652.50 to 660!
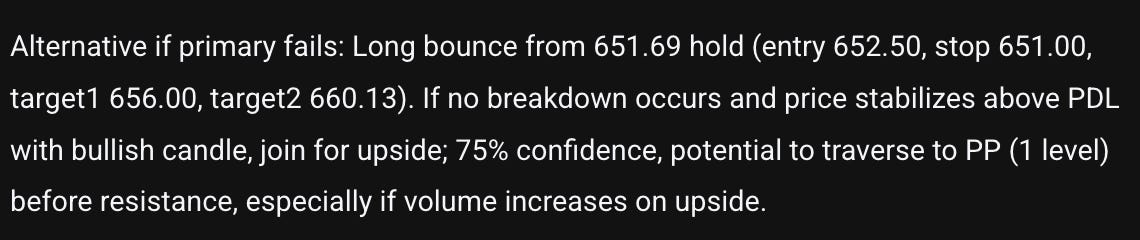
One of the key things I’ve taught Spectre AI is make bull and bear plans. if the primary idea fails, many times the “being wrong” idea pays incredibly well.
This was the “being wrong” idea.
I’m continuing to work diligently on this. I’m working on the logic for what triggers SpectreAI to publish the analysis. Exciting things coming! Let’s get more consistency, more profits, more time, and less candle whiplash!
Overall I strongly believe that we are in for a correction with AI. we might get some rallies, but Q1 26 will be where the reality will show on the books!
SPY/SPX VIDEO
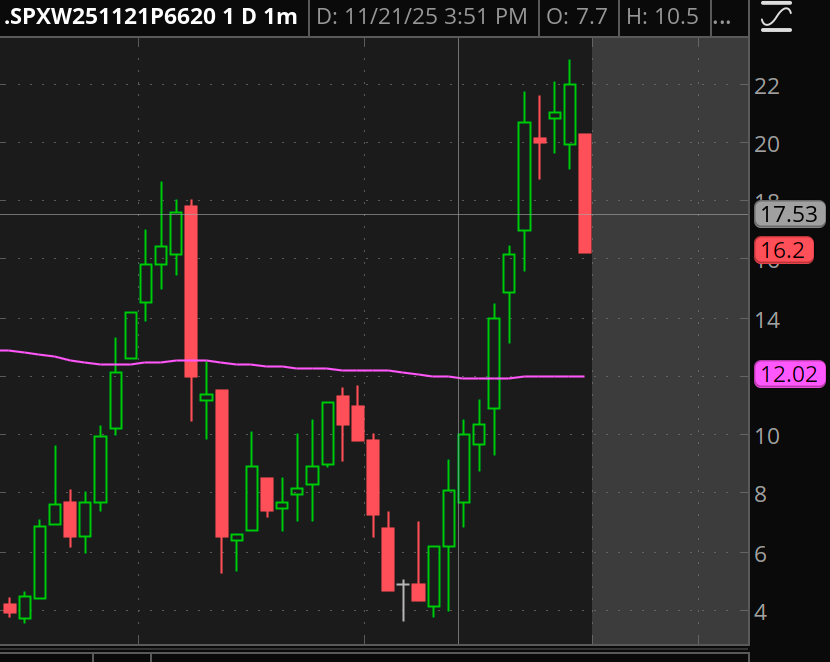
Checkout the payout on the SPX 6620p!!! 5→20! :)
If you are tired of overtrading, not knowing how to plan trades, and want to make more in less time, come join us.
What is Two Hour Trading?
Two Hour Trading is my system for finding and executing trades while spending less than two hours a day trading. My goal is to earn 100-300% on the capital I risk while waiting for 1000%+ gain trades to set up. Key benefits include:
High-quality trades with excellent reward vs. risk
Avoiding overtrading and losses from it
Trading to win vs. trading not to lose
Stacking the deck in your favor
If you are busy and want to see my commentary and ideas in real time consider joining THT-PRO.
Plan for Mon Nov 24
Stick to process. The process and trade setups I teach works. Rinse and repeat over and over again. There will be losses. Any good system will have them. Being systematic also means the gains will repeat and come again too. If you keep changing your system/process trying in an effort to never lose a trade, you will never get to where you want to go.
Survive SPY’s Choppy Waters: Secure Your Edge
Pinpoint today’s pivot at 659.63 to dodge downside traps and capture upside momentum.
Market Context
SPY has been trading in a volatile range over the past week, oscillating between 649.45 and 676.26, with recent sessions showing choppy action around the 660-670 zone. The chart reveals a series of failed breakouts above 673, followed by quick pullbacks, suggesting a neutral to slightly bearish bias amid broader market uncertainty. Volume spikes during these reversals indicate institutional positioning, but the lack of clear trend continuation points to range-bound behavior—watch for a decisive move above the pivot to signal bullish control or a breakdown below supports for bearish acceleration.
Key Events This week
Tuesday - Core PPI
Wednesday - Jobless Claims
Thursday - Thanksgving holiday
Friday - Early close 1pm
